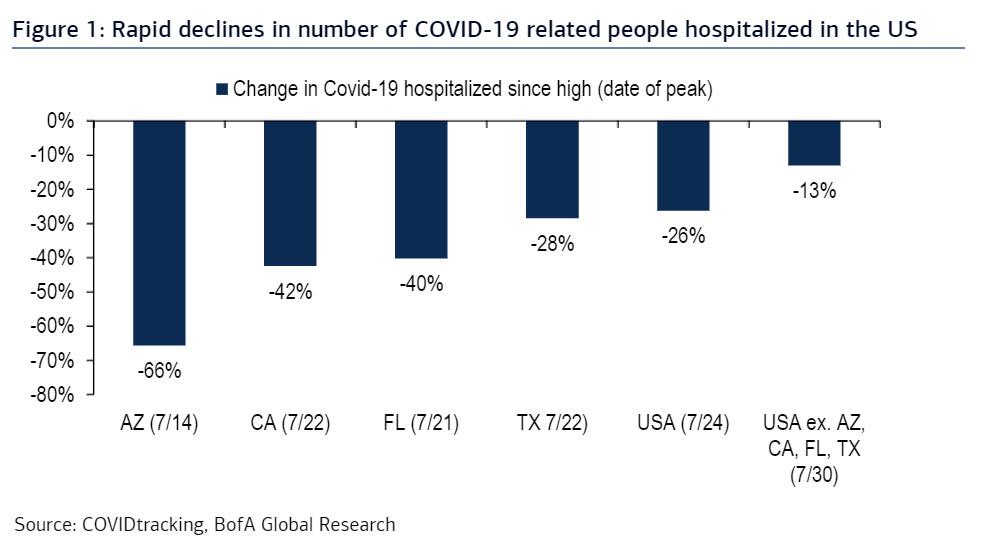
Back on July 14 when a wave of new covid cases was sweeping the sunbelt states prompting many to speculate if a new round of shutdowns was imminent, we took the other side of the argument and said that the pandemic peak had hit, and that in Arizona – an early recent outbreak state, “the worst was over for the COVID breakout.” We were right, and as Bank of America writes today, Arizona has seen a 66% decline since its peak on July 14th, while the US excl. the four major recent outbreak states (AZ, CA, FL, TX) experiencing a 13% decline since the peak on July 30th.
There’s more: as BofA also points out, “we continue to see clear signs the Coronavirus is rolling over in the US as the number of people hospitalized due to COVID-19 declines at a rapid pace of about one percent a day (26% in 23 days).”
Extrapolating, this rate of decline means that there will be zero covid-related hospitalizations around the Nov 3 election day, a feat that if marketed properly, could mean the differnce for Trump between victory and defeat.
Some more observations from BofA:
This week saw front page headlines that official COVID-19 statistics can no longer be trusted due to decreasing testing volumes. We agree but are wondering why there were no such headlines when daily new cases were rising due to more testing.
This is why we rely on statistics for the number of people hospitalized due to COVID-19. Drawback is that hospitalizations are lagged indicators of infections. Let’s assume for this discussion that the lag is three weeks. The recent peak number of hospitalized on July 24th suggests peak daily new COVID-19 infections in the US around Independence Day (July 4th).
But daily new COVID-19 cases continued to rise sharply in July, which dominated the headlines. It looks like daily new cases and the number of people hospitalized are virtually coincident, as the peaks for both were reached around the same time. This actually makes sense as probably the primary driver of testing is someone going to the hospital with COVID-19 symptoms. We imagine that person gets tested along with the immediate family, friends and colleagues. Because COVID-19 statistics are very persistent, it seems likely that the numbers continue to roll over.
There is little doubt that all these negative COVID-19 related headlines have weighed on consumer, business and investor confidence. As this now reverses we remain positioned for a re-steepening Treasury curve by expecting bull flattening IG corporate spread curves, compression along the quality curve and outperformance of the most COVID-19 negatively impacted names. Heavy new issuance remains a headwind, but it is mitigated by strong inflows. Next week should be busy and then the window closes in the two weeks before Labor Day.
It wasn’t just Bank of America that had good news: in its state-level coronavirus tracker, Goldman confirmed that the number of new confirmed coronavirus cases continues to decline in the vast majority of states, yet the bank urged some caution, noting that “although the nationwide downward trajectory is encouraging, state government officials may wait until case levels decline further before moving forward with additional reopening policies.”
Ironically, there is just one state where there is a tangible number of new cases – the one which was among the first to permit protests (and riots) in late May and early June: as Goldman notes, “Cases are on the rise in the most populous state of California, which has faced technical difficulties in reporting accurate daily case counts.”
